Custom dashboards
Data Studio dashboard development, built around the decisions you make
Data Studio dashboard development is where I spend most of my time: designing and building custom reports from your own sources, for teams that want one person to own the build from first sketch to handover. You get a dashboard with the metrics defined, the logic documented and the data sources set up so it keeps working after I leave.
Quick answer
How do you build a custom Data Studio dashboard?
Data Studio dashboard development starts with the decisions the report must support, not the charts. I list the metrics and their definitions, pick the right sources and connectors, prepare the data so blends and calculated fields stay simple, then build pages with scorecards, trends and drill-down tables, test with real viewers, and hand over documented logic.
- Metric definitions are agreed in writing before any chart is placed on a page.
- Heavy logic moves into Sheets or BigQuery when blends would hit the five-source limit.
- Every dashboard ships with documented calculated fields and deliberate data source credentials.
- You see a live draft with your own data early, not a mock-up.
What goes into Data Studio dashboard development?
Most of the effort goes into the parts you never see on screen. A dashboard that looks finished in an afternoon can take weeks to trust, because the hard questions are about definitions: what counts as a conversion, which date a sale belongs to, and whether returns are netted out before or after the target comparison.
So a build with me starts with a short metric sheet. Each KPI gets a name, a formula, a source and an owner. Only then do I open the editor. That sheet becomes part of the handover, and it settles arguments later when someone asks why a number moved.
- Requirements: the five to ten decisions the report should support, and who makes them.
- Data model: which sources, at what grain, joined on which keys.
- Logic: calculated fields, CASE statements, parameters and filters.
- Design: page structure, chart choice, controls and mobile behavior.
- Operations: credentials, sharing, scheduled delivery and documentation.
What makes a custom Data Studio dashboard different from a template?
A template gives you charts. A custom Data Studio dashboard gives you your business logic. Templates assume your GA4 channels, campaign names and targets look like everyone else's, and they rarely do. The moment you need revenue net of refunds, targets by region, or a channel grouping that matches how your sales team talks, a template needs rebuilding anyway.
Templates are a reasonable starting point for a single-source report with standard fields. When two or more sources have to agree, or when the report goes to leadership, custom work usually pays for itself in the hours nobody spends reconciling numbers by hand.
What you get
What I build
Scoped and quoted at a fixed price after a free review.
Metric sheet
A written list of every KPI with its formula, source, grain and owner, agreed before the build.
Custom dashboard
A multi-page Data Studio report with scorecards, trends, drill-down tables and consistent controls.
Prepared data sources
Clean sources in Sheets, BigQuery or native connectors, with blends kept within the five-source limit.
Parameters and filters
Target parameters, metric selectors and cross-source filters so viewers can answer follow-up questions themselves.
Sharing and credentials
Owner's or viewer's credentials set per source, sharing groups tested, and ownership in your account.
Handover pack
Field documentation and a recorded walkthrough so your team can extend the dashboard later.
How do I structure a Data Studio dashboard so people actually use it?
Put the answer at the top and the evidence below it. My default page has a row of scorecards with comparison periods, one or two trend charts, and a drill-down table at the bottom. Controls sit in one consistent place, and every page has a clear date range.
I keep each page to one question. A sales overview page, a channel page, a product page and a detail page usually beat one long page with thirty charts. Viewers can now refresh data manually, open charts fullscreen and export a chart as PNG, so a lean page is also easier to share in a meeting.
Parameters do a lot of quiet work. A target parameter lets a manager test a new goal without editing the report. A metric selector lets one chart switch between revenue, orders and conversion rate, which keeps pages short. Cross-data-source filtering, added in January 2026, means one date or region control can now filter charts built on different sources.
Which chart types and limits matter in a Data Studio dashboard?
Scorecards, time series, bar charts, tables with heatmaps, geo maps and the newer histogram chart cover nearly every business report. The real constraints are not visual. Tables on fixed-schema sources such as GA4 and Google Ads take up to 10 dimensions and 20 metrics, while Sheets, BigQuery and SQL sources allow 100 of each.
Blends join up to five sources with equality joins only, and a blend lives inside one report. When a design needs more than that, or needs a fuzzy match on campaign names, I prepare the data upstream in a Sheet or a BigQuery table. That keeps the dashboard fast and the logic in one place instead of scattered across report-level blends.
Large queries can also return "too many rows" errors. Aggregating before the data reaches the chart, or using an extract for slow-changing history, usually solves it.
What does a finished build look like? A retail example
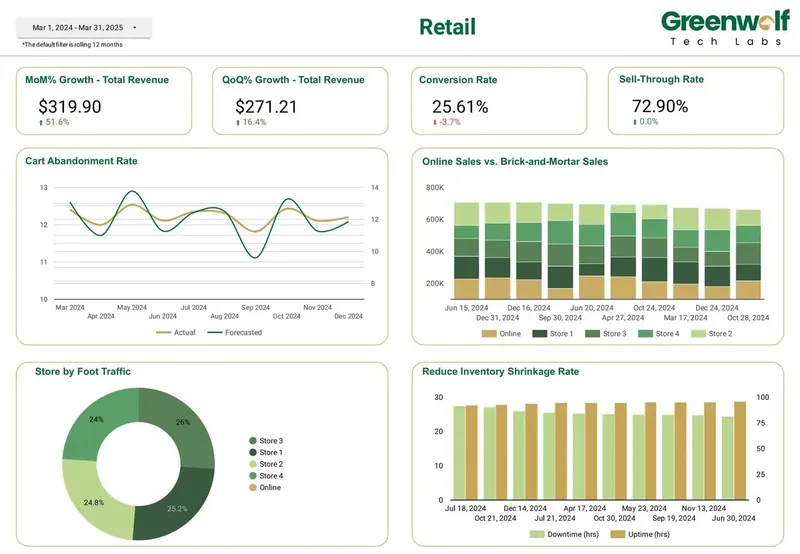
One retail dashboard I led at Greenwolf Tech Labs shows the pattern. Leadership wanted month-over-month and quarter-over-quarter revenue growth, conversion rate, sell-through rate and cart abandonment against forecast, with online and in-store sales compared side by side.
The operations team needed different things on a separate page: store foot traffic and inventory shrinkage. Splitting the audiences into their own pages, with shared date and store controls, kept each page readable while the underlying sources stayed common. The same approach works for finance dashboards that bring cash, revenue, spend and margin into one view.
When should you hire a Data Studio developer instead of building it yourself?
Build it yourself when the report has one source, standard fields and a small audience. Data Studio is free and the editor is approachable, and a GA4 overview for your own use is a fine weekend project.
Bring in a Data Studio developer when two or more sources must agree, when the report goes to clients or leadership, when viewers keep hitting quota or permission errors, or when the person who built the original has left. Those are the cases where a few hours of expert setup save months of patching. Since the product went from Looker Studio back to Data Studio in April 2026, I also see teams use a rebuild as the moment to clean up years of copied reports.
How it works
How a project runs
- 01
Discovery call
We list the decisions the dashboard must support and the sources that hold the answers.
- 02
Metric sheet and quote
I write the metric definitions and send a fixed price for the agreed pages and sources.
- 03
Data preparation
I connect and clean the sources, and move heavy joins upstream where needed.
- 04
Draft and review
You review a live draft with real data, and I revise layout and logic from your comments.
- 05
Launch and handover
I set credentials and scheduled delivery, transfer ownership and record the walkthrough.
FAQ
Frequently asked questions
How long does Data Studio dashboard development take?
It depends on the number of sources and how clean they are. A single-source report is a much shorter job than a dashboard that blends ad platforms, GA4 and a CRM export. I give you a timeline with the fixed quote after a free review, so you know before we start.
Can you build a Data Studio dashboard from Excel files?
Yes. Excel files usually go into Google Sheets or BigQuery first, because Data Studio reads those directly and they handle cleaning rules well. For recurring files, I automate the load so the dashboard refreshes without anyone pasting data.
Do I own the dashboard after you build it?
Yes. The report and data sources are transferred to your Google account, and credentials are set so nothing depends on my login. You also get the metric sheet and documentation.
Can a Data Studio dashboard combine more than five data sources?
Not in a single blend, which is capped at five sources with equality joins. The usual fix is to combine the data upstream in Google Sheets or BigQuery, then connect the dashboard to that one prepared source.
Will my custom Data Studio dashboard work on mobile?
It can, if it is designed for it. I keep key scorecards at the top, avoid wide tables on summary pages, and test the report on a phone before handover.
Can you add pages to a dashboard I already have?
Yes. I review the existing data sources and calculated fields first so new pages follow the same definitions. If the existing logic has problems, I flag them before building on top of it.
Keep reading
Related pages
Get started
Tell me what the report has to answer
Send the question your team keeps asking and where the data lives today. I reply within one business day with how I would build it, which connectors it needs and what it would cost.
- Free 30-minute review of your data and reports
- A fixed price before any work starts
- Built in your Google account, so you own everything
Prefer email? harsh@greenwolftechlabs.com
Book a free review
Two lines is enough to start.