Dashboards and reporting pipelines from projects I led at Greenwolf Tech Labs. Screens are shown with sample data; client names are withheld.
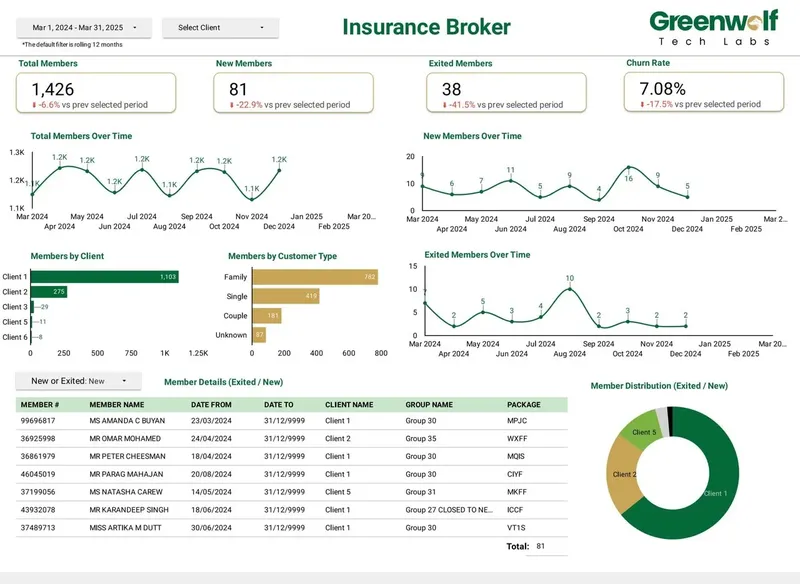
Insurance broker dashboard built in Data Studio (sample data)
Case study · Insurance brokerage, Australia
From 4-5 hours of spreadsheet work to a report in under 5 minutes
A project I led at Greenwolf Tech Labs. Monthly reports were assembled by hand from inconsistent .xls files sent by several insurers. The files now land in Google Drive, are mapped into one central sheet with the business rules applied, and feed a Data Studio dashboard.
Report time: 4-5 hours to under 5 minutes
Reporting accuracy: about 75% to 99%
Visibility across insurers: limited to real time, with filters
Members joined, exited and retained per client scheme, with churn by customer type.
Refreshed from the policy administration export instead of being rebuilt in a spreadsheet every month, with a filterable member list behind every chart.
PharmaBrand performanceGeo
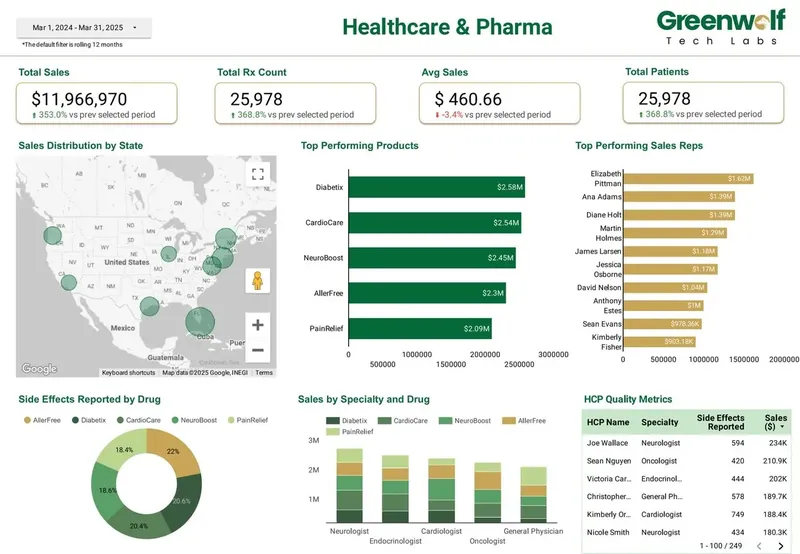
Healthcare and pharma dashboard
Sales and Rx volume by product, state and rep, with HCP-level metrics.
Brand leads see which product is behind plan and whether field activity or channel explains it, with access limited by team and territory.
RetailEcommerceStores
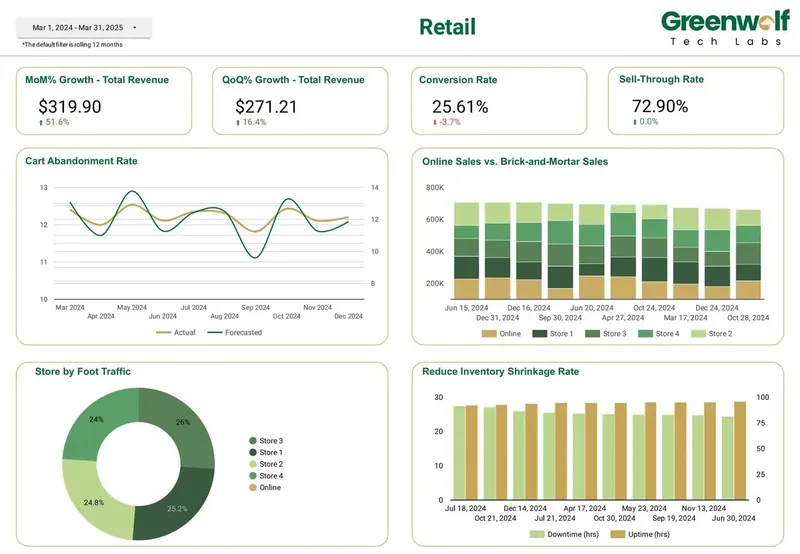
Retail dashboard
Revenue growth, conversion, sell-through, cart abandonment and store foot traffic.
Online and in-store sales on one page, with the conversion and sell-through numbers a trading meeting actually argues about.
ManufacturingDowntimeQuality
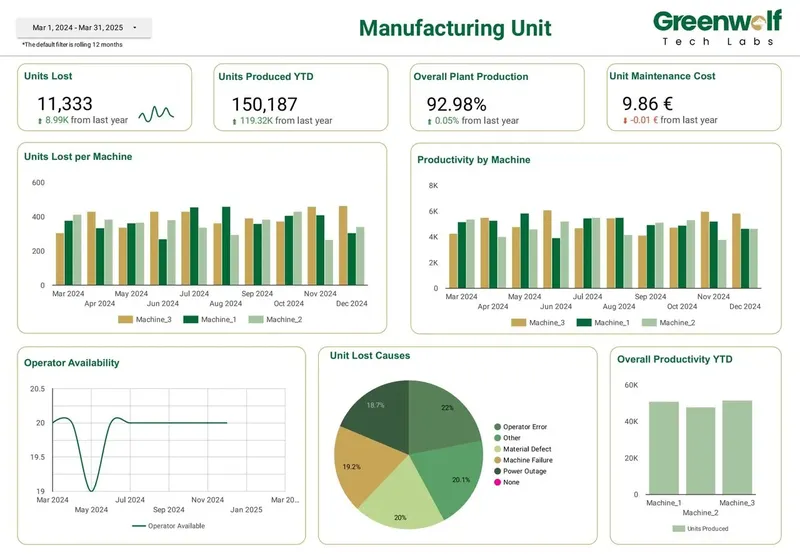
Manufacturing unit dashboard
Units produced and lost, productivity by machine and causes of loss.
Production, quality and downtime from systems never designed to be read together, ranked so the biggest losses surface first.
LogisticsOrdersFleet
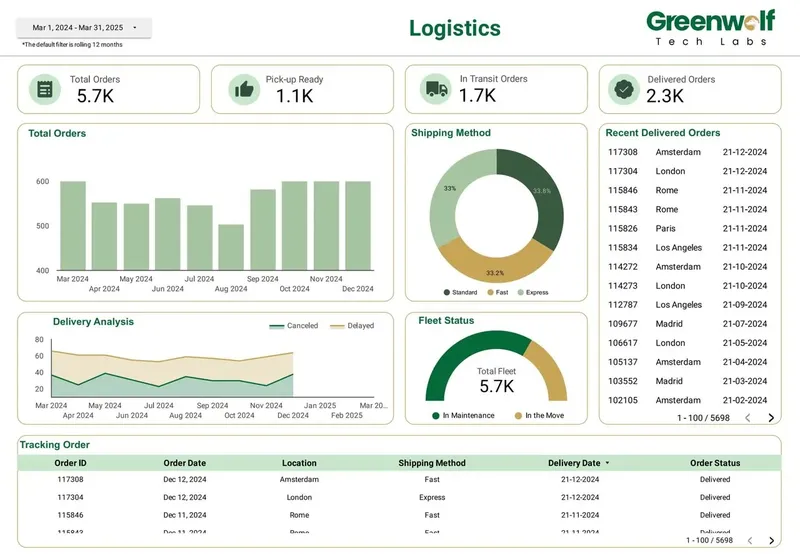
Logistics dashboard
Orders by stage, shipping method mix, delays and fleet status in one view.
Every order's status in one view, joined from the order system and carriers, so operations answers "where is it?" without opening three portals.
ProcurementSpendSupplier risk
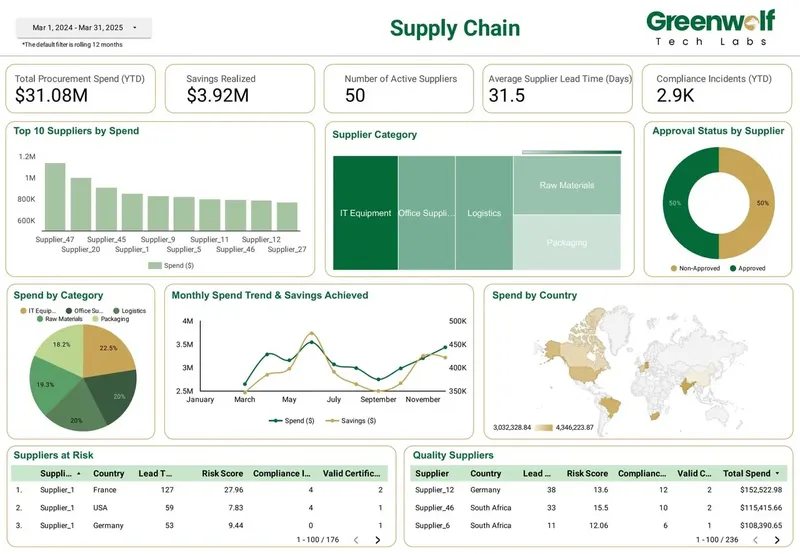
Supply chain and procurement dashboard
Spend by supplier, category and country, savings and suppliers at risk.
Vendor spend, savings, lead times, compliance incidents and approvals for a sourcing team that runs its week on it.
Also built in Data Studio
CFO and marketing dashboards
I have also built CFO dashboards that put cash, revenue, spend and margin on one page for finance leaders, and multi-channel marketing dashboards that join Google Ads, Meta, LinkedIn, GA4 and Search Console into one view of spend, leads and return. These are shown on request, because they contain client figures.
Selected organisations
.
Get started
Tell me what the report has to answer
Send the question your team keeps asking and where the data lives today. I reply within one business day with how I would build it, which connectors it needs and what it would cost.
Free 30-minute review of your data and reports
A fixed price before any work starts
Built in your Google account, so you own everything