Audit and repair
Data Studio report not working? I find the cause and fix it
Data Studio report not working is one of the most common messages I get, usually from a marketer or analyst who inherited a report and now owns its errors. I audit and repair existing reports for teams who need them trusted again quickly, and you get a written list of what was wrong, what I fixed and what to watch.
Quick answer
Why is my Data Studio report not working?
The usual reasons for a Data Studio report not working are data source credentials tied to someone who left, GA4 quota errors, blends with mismatched join keys, retired fields from a connector update, and calculated fields that broke when a source changed. Most can be fixed without rebuilding, once the real cause is found.
- Most broken reports trace back to credentials, quotas, blends or retired fields.
- Data Studio gives no warning when a connector breaks, so errors surface late.
- A repair keeps existing URLs and bookmarks, which a rebuild does not.
- Every fix comes with a written note of the cause and the change.
Why is my Data Studio report not working?
Because something underneath the chart changed, and Data Studio does not warn you when a connector breaks. The chart simply shows an error, a blank, or a number that quietly drifts. By the time someone notices, the report has often been wrong for weeks.
These are the causes I see most often, roughly in order of frequency.
- Credentials: a data source uses owner's credentials from an account that left the company or lost access.
- Quota: GA4 charts fail with quota errors when many charts and viewers share the hourly token budget.
- Blends: join keys stopped matching after a naming change, so rows silently drop out.
- Retired fields: a connector removed a field, such as the Google Ads location extension fields sunset on May 4, 2026.
- Schema changes: a column was renamed in a Sheet or table, breaking every calculated field that used it.
- Size: large queries hit "too many rows" errors or time out.
How do I fix data source credential errors in Data Studio?
Check whose credentials each data source uses, then move them to an account that will stay. Owner's credentials mean viewers see data through the data source owner's access. Viewer's credentials mean each viewer needs their own access to the underlying data. Both are valid, and both cause errors when set by accident.
The classic failure is a report built by a freelancer or a former employee, where every source runs on that person's credentials. When their access ends, the whole report goes blank. I reassign ownership to a shared or service-owned account, re-authorize each source, and test the report as a typical viewer.
What you get
What I build
Scoped and quoted at a fixed price after a free review.
Audit report
A written list of every data source, its credentials, blends and calculated fields, with problems ranked by impact.
Credential cleanup
Data sources moved to a durable owner and re-authorized, tested as a typical viewer.
Blend and field repairs
Fixed join keys, replaced retired fields and calculated fields rewritten where they broke.
Performance fixes
Pages split, tables trimmed, and extracts or BigQuery tables added where reports were slow.
Reconciliation note
Each key metric checked against its source, with intentional differences labeled on the report.
Why does my report show a configuration error or a broken blend?
A configuration error usually means a chart refers to a field, metric or dimension that no longer exists or is no longer compatible. It shows up after connector updates, after someone renames a Sheet column, or when a calculated field depends on another field that was deleted.
Blends break in subtler ways. A blend joins at most five sources with equality joins only, so a trailing space, a changed campaign naming convention or a date in a different format means rows stop matching. The chart still loads, just with smaller totals. I compare blended totals against each source on its own to find where rows are lost, then fix the key or move the join into Sheets or BigQuery where it can be checked.
Why is my Data Studio report so slow?
Slow reports usually send too many heavy queries at once. Long pages with dozens of charts, wide tables, many blends, and live GA4 queries over long date ranges all add up.
The repairs are practical: split pages, remove unused charts, reduce dimensions in large tables, replace slow history with extracts, and pre-aggregate in BigQuery for the heaviest sources. Fixed-schema sources like GA4 and Google Ads also cap tables at 10 dimensions and 20 metrics, so tables designed beyond that will never behave well.
What if the numbers in my report disagree with the source?
Treat it as a definitions problem until proven otherwise. Differences between a report and GA4, Google Ads or a CRM usually come from date ranges, time zones, filters on the data source, different conversion columns, or a calculated field that sums a ratio instead of recalculating it.
I reconcile one metric at a time against the source, document each difference, and fix the ones that are mistakes. Some differences are legitimate, such as GA4 key events against CRM leads, and those get a label on the page instead of a fix.
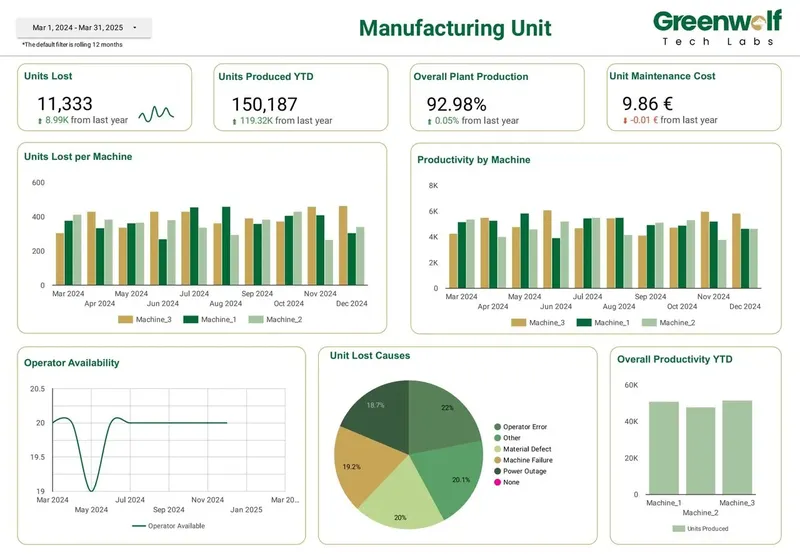
A manufacturing dashboard I led at Greenwolf Tech Labs is a good example of why this matters. It tracks units produced and lost, units lost per machine, productivity by machine, operator availability, causes of unit loss and maintenance cost. When numbers like those feed maintenance decisions, a definition error is not cosmetic.
Should I fix the report or rebuild it?
Fix it when the structure is sound and the problems are specific. A repair keeps existing URLs, bookmarks and scheduled deliveries, and your team does not have to relearn the layout.
Rebuild when the logic is copied across dozens of report-level calculated fields with no documentation, when every page fights quota limits, or when the report answers questions nobody asks anymore. I tell you which case you are in after the audit, before you pay for either. Upcoming deprecations, such as MySQL 5.6 and 5.7 support ending by February 26, 2027, are also worth checking now if your reports use those databases.
How it works
How a project runs
- 01
Send the report
You share edit access and describe what looks wrong.
- 02
Free first look
I identify the likely causes and send a fixed quote for the repair.
- 03
Audit and fix
I work through sources, credentials, blends and fields, fixing as I go.
- 04
Verify
I test as a viewer and reconcile key numbers against the sources.
- 05
Document
You get a short note of every cause and change, so the next fix is faster.
FAQ
Frequently asked questions
Why does my Data Studio report say there is a configuration error?
A chart refers to a field that no longer exists or is incompatible with the other fields in that chart. It often follows a connector update, a renamed Sheet column or a deleted calculated field. Replacing or recreating the missing field usually clears it.
Why do my viewers see an error but I don't?
Usually because the data source uses viewer's credentials and those viewers lack access to the underlying data. Either grant them access or switch the source to owner's credentials, choosing deliberately based on how sensitive the data is.
How do I fix GA4 quota errors in a Data Studio report?
Reduce the number and weight of GA4 queries. Split long pages, trim dimensions in big tables, reuse one GA4 data source, and use extracts or the GA4 BigQuery export for history. Standard properties allow 14,000 tokens per project per property per hour.
Can you fix a report built in Looker Studio?
Yes. Reports built under the old name moved to Data Studio automatically in April 2026, so the report is the same file. I repair it in place, and the old link still redirects to the new address.
Why did my blended data suddenly drop rows?
Blends use equality joins only, so if a join key changed format or naming, rows stop matching and quietly disappear. Comparing blended totals with each source on its own shows where the rows went.
How do I know if my report is broken if Data Studio doesn't alert me?
Data Studio gives no warning when a connector breaks. A simple check is a scheduled delivery to yourself, or a small validation page that compares totals with the source each week, so breaks are spotted early.
How much does it cost to fix a Data Studio report?
I quote a fixed price after a free first look, because a single expired credential and a report with ten broken blends are very different jobs. The quote lists what I will fix, so you know the scope before any work starts.
Keep reading
Related pages
Get started
Tell me what the report has to answer
Send the question your team keeps asking and where the data lives today. I reply within one business day with how I would build it, which connectors it needs and what it would cost.
- Free 30-minute review of your data and reports
- A fixed price before any work starts
- Built in your Google account, so you own everything
Prefer email? harsh@greenwolftechlabs.com
Book a free review
Two lines is enough to start.