Connector guide
Data Studio custom connector: when to build one, how it works and what it costs
A Data Studio custom connector is a small Google Apps Script project that lets Data Studio read data from a source Google does not connect to, such as your own API, an internal database or a niche SaaS tool. This guide is for marketing, operations and finance leads who have been told they need one. I explain how a connector works, the limits that decide whether it will be fast enough, the alternatives that are often cheaper, and how I scope connector projects.

Quick answer
How do I connect Data Studio to a data source that has no connector?
Build a Data Studio custom connector (Google calls it a community connector) in Apps Script, or move the data into Google Sheets or BigQuery first. A connector suits live API data used by a few reports. A Sheets or BigQuery pipeline suits large, slow or messy sources, and a partner connector is usually cheaper for mainstream platforms.
- A custom connector is Apps Script code with four required functions: auth type, config, schema and data.
- Apps Script limits, such as 6 minutes per execution, decide whether a connector stays fast.
- Check partner connectors first: for mainstream platforms they usually cost less than building.
- Large or messy sources often work better loaded into Sheets or BigQuery on a schedule.
What is a Data Studio custom connector?
It is code that teaches Data Studio how to log in to a source, which fields it offers and how to fetch rows on request. Google's developer documentation calls these community connectors (they kept that name through the Looker Studio years), and they are written in Google Apps Script against Google's Connector API.
Every connector must define four functions. getAuthType tells Data Studio how the user signs in. getConfig asks the user for settings, such as an account ID or a date range requirement. getSchema returns the list of dimensions and metrics with their types. getData returns rows for the fields a chart actually requested. Once deployed, the connector appears as a data source like the native GA4 or Google Ads connectors, and your reports, calculated fields, filters and scheduled delivery work on top of it as usual.
Google's documentation lists seven supported auth types: OAuth 2.0, USER_PASS, USER_TOKEN, KEY, PATH_USER_PASS, PATH_KEY and NONE. Credentials must be stored in the user's own properties (PropertiesService.getUserProperties), not typed into configuration fields, so an API key never ends up visible to other report editors.
Do you need a custom connector, a partner connector or a data pipeline?
Most teams that ask me for a custom connector end up needing something else. Before any code is written, I put the source through three questions: is there already a connector for it, how much data does each report need, and how fresh must it be?
Data Studio connects natively to GA4, Google Ads, Search Console, Sheets, BigQuery, YouTube, Campaign Manager 360, Display and Video 360, Ad Manager, Cloud SQL, MySQL, PostgreSQL, SQL Server and Redshift. Partner connectors from vendors such as Supermetrics, Windsor.ai, Porter Metrics, Funnel, Power My Analytics and Catchr cover hundreds of common platforms for a monthly fee. A custom build only makes sense where neither covers your source, or where the vendor cannot shape the data the way your reports need.
| Option | Best for | Freshness | Main drawback |
|---|---|---|---|
| Native connector | Google sources and supported databases | Live | Only covers Google's list |
| Partner connector | Mainstream ad, CRM and ecommerce platforms | Live or scheduled, by vendor | Monthly subscription, vendor controls the schema |
| Custom (community) connector | Your own API, internal systems, niche SaaS | Live on each request | Apps Script limits and ongoing maintenance are yours |
| Sheets pipeline | File exports, small volumes, rules your team edits | Scheduled | Sheets slows down as rows grow |
| BigQuery pipeline | Large volumes, history, many viewers | Scheduled or streamed | Needs modelling and a Google Cloud bill |
What can a community connector connect to?
Almost anything reachable over the internet. Google's documentation names four routes: web APIs, JDBC databases, flat files in CSV, JSON or XML, and other Apps Script services. In practice the requests I see fall into three groups.
The first is an in-house system with an API, such as an order platform, a booking engine or a policy administration tool. The second is a niche SaaS product that the big connector vendors do not support. The third is a product company that wants its own customers to report on its data in Data Studio, which is the case where publishing the connector publicly makes sense.
- Internal REST APIs with key or token authentication.
- Industry SaaS tools with an API but no partner connector.
- Databases reachable through JDBC that the native connectors do not cover.
- Hosted CSV, JSON or XML files that update on a schedule.
How is a Data Studio custom connector built, step by step?
The build itself is the smaller part. Most of the effort sits in agreeing the fields, handling the source's quirks and testing against numbers the business already trusts. This is the sequence I follow.
- Scope: list the reports the connector feeds, every field they need, its type, and the totals to reconcile against.
- API review: authentication method, pagination, rate limits, date filtering and how far back history goes.
- Auth: pick the matching auth type and store credentials in user properties, with clear errors when a key expires.
- Config and schema: define the settings users choose and a typed schema, with dimensions and metrics named the way your team talks.
- getData: fetch only the requested fields and date range, page through results, and map them to the schema.
- Caching: store recent responses so repeated chart loads do not call the API again.
- Errors: return readable messages instead of a blank chart, because Data Studio gives no warning when a connector breaks.
- Deploy and test: create a versioned deployment, connect it in a test report, reconcile totals, then share it with your team.
- Handover: code in your own Google account, a short document of fields and limits, and a walkthrough.
What limits should you plan for before building a connector?
Apps Script quotas set the ceiling, so check them against your data volume first. The figures below come from Google's Apps Script quotas page and Cache service reference, both read in October 2026. The URL Fetch figure is per day for the account running the script, which matters when many viewers open a report at once.
Data Studio's own limits still apply on top. Blends hold up to 5 data sources with equality joins only, and very large queries return too many rows errors. A connector does not lift either limit.
| Limit | Value | What it means for a connector |
|---|---|---|
| Script runtime | 6 minutes per execution | Slow or deeply paged APIs must be cached or pre-loaded |
| URL Fetch calls | 20,000 per day (consumer accounts), 100,000 per day (Google Workspace) | Busy reports with many charts can exhaust it without caching |
| URL Fetch response size | 50 MB per call | Big exports need paging or a warehouse |
| Properties value size | 9 KB per value | Fine for credentials, not for storing data |
| Cache entry | 100 KB per key, up to 6 hours | Cache aggregated results, not raw rows |
| Simultaneous executions | 30 per user | Many charts loading together can queue |
Why are custom connectors slow, and how do you keep them fast?
Each request for data runs Apps Script before your source is even asked, and pages with many charts and many viewers make many requests. In a July 2025 thread on Google's developer forum (discuss.google.dev, titled Custom Connectors Very Slow), a developer reported that charts took more than 10 seconds to render even when the connector returned a tiny hardcoded result, and the thread had no solution posted. That matches what I see: overhead per call, multiplied by charts per page.
The fixes are mostly design decisions rather than clever code. Fewer charts per page, filters that narrow the request, and responses aggregated before they reach Data Studio all help. Where the data is large or the API is slow, the better answer is to load it into BigQuery on a schedule and point Data Studio at a partitioned table, which removes Apps Script from the viewing path entirely.
- Return only the fields and date range the chart requested.
- Aggregate in the API or in a cache layer, not row by row in Data Studio.
- Cache per user and per query so repeat visits do not hit the API.
- Keep pages to the charts people actually read.
- Move to a scheduled BigQuery load once volume or viewer count grows.
Should the connector stay private or be published in the gallery?
Keep it private if it reads your own company's data. Google's documentation confirms a connector can be shared directly with any user, which is all an internal reporting team needs, and it avoids a review process built for public products.
Publish it if you are a software company and want customers to report on your data. Google's partner connector requirements are specific: a Production deployment, view access shared with Google's review addresses, a hosted page on your own domain with a privacy policy and terms of use, a support page rather than an email link, a logo hosted under your control, explicit OAuth scopes, completed OAuth client verification, and a connector that is finished rather than in beta. Budget time for that review on top of the build.
How much does a Data Studio custom connector cost?
The build is the main cost, and running costs are usually small. Apps Script itself has no licence fee within the quotas above, and Data Studio is free for creators and viewers. Data Studio Pro, at $9 per user per project per month, is only needed if your team wants Pro workspaces and organisation-owned content, not to use a connector.
What moves the build price is the source, not the charts. An API with key authentication, clean JSON and a date filter is a modest job. OAuth, deep pagination, inconsistent field names, missing history or strict rate limits each add work, and a gallery submission adds more. For context, rates published by agencies such as halo-lab.com put freelance Data Studio consultants at roughly $100 to $200 per hour, though a fixed price against a written scope is easier to compare.
Do the comparison honestly. If a partner connector already covers your platform, its subscription is often cheaper than building and maintaining your own code, and I will say so in the review.
Common mistakes, and when not to build a custom connector
Most failed connector projects share the same causes, and none of them is the code. They are scoping and ownership problems that show up months later, usually when someone leaves or the source API changes.
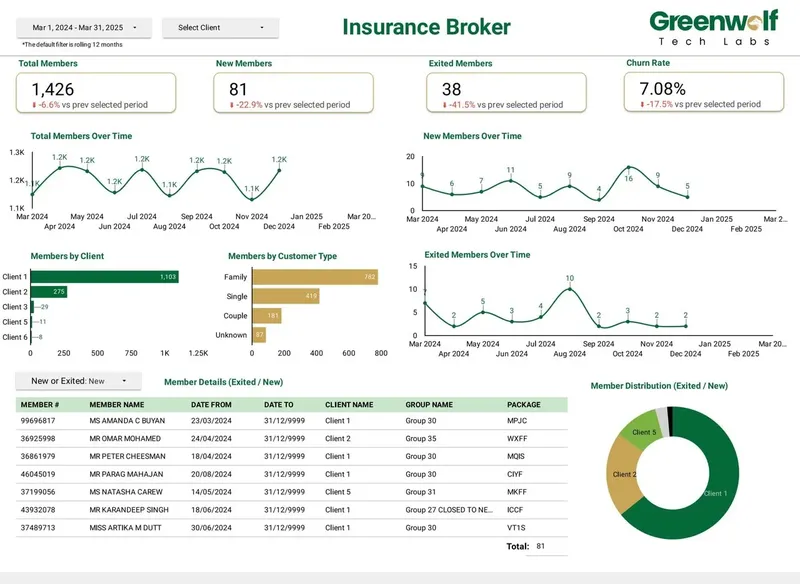
Sometimes the right answer is no connector at all. For an Australian insurance brokerage that received messy .xls files from several insurers, a project I led at Greenwolf Tech Labs automated the files into Google Drive, mapped them into a central Google Sheet with business rules applied, and fed the dashboard from there. Report preparation fell from 4 to 5 hours to under 5 minutes, and reporting accuracy rose from about 75% to 99%. A connector would not have fixed those files; a pipeline did.
- Building for a platform that a partner connector already supports.
- Fetching raw rows and aggregating in Data Studio, which hits quotas fast.
- Leaving the script in a contractor's personal account.
- Putting API keys in configuration fields instead of user properties.
- Skipping reconciliation, so nobody trusts the first report.
- Do not build one when the source is a file export, the data is very large, or nobody will maintain the code after launch.
How I work on connector projects
You work with me directly, from the first review to the handover. I start by reading your API documentation or a sample export and the reports you want, then recommend the cheapest route that will hold up: a partner connector, a custom connector, or a Sheets or BigQuery pipeline. You get a fixed quote for that route after a free review, with running costs listed separately.
The code, deployments and data sources live in your Google account from day one, so nothing depends on me staying involved. If the connector feeds a new dashboard, I build that too, and if an existing report broke after a source change, I can repair it instead.
Case study · Insurance brokerage, Australia
From 4-5 hours of spreadsheet work to a report in under 5 minutes
A project I led at Greenwolf Tech Labs. Monthly reports were assembled by hand from inconsistent .xls files sent by several insurers. The files now land in Google Drive, are mapped into one central sheet with the business rules applied, and feed a Data Studio dashboard.
- Report time: 4-5 hours to under 5 minutes
- Reporting accuracy: about 75% to 99%
- Visibility across insurers: limited to real time, with filters
FAQ
Frequently asked questions
What is the difference between a community connector and a partner connector?
Both are built on the same Connector API in Apps Script. A partner connector is one a company has published in the Data Studio gallery after Google's review, usually sold as a subscription. A community connector is any connector you build yourself, and it can stay private to your team.
Can Data Studio connect to a REST API?
Not natively. You need either a custom connector that calls the API in Apps Script, or a scheduled job that loads the API data into Google Sheets or BigQuery. The connector suits smaller, live data, and the pipeline suits large or slow APIs.
Do I need to know JavaScript to build a Data Studio connector?
Yes. Connectors are written in Google Apps Script, which is JavaScript, and you will also handle authentication, paging and error handling for the source API. Google's codelab is a good start for developers, while teams without one usually hire the build.
Why does my custom connector say it exceeded a quota or timed out?
Apps Script stops any execution after 6 minutes and caps URL Fetch calls per day, 20,000 on consumer accounts and 100,000 on Google Workspace. Busy reports multiply calls, because more charts and more viewers mean more data requests. Caching, aggregation and fewer charts per page usually solve it.
Is it free to use a custom connector in Data Studio?
Using one costs nothing in Data Studio, and Apps Script has no licence fee within its quotas. You pay for the build and maintenance, plus any costs of the source itself, such as BigQuery queries or a paid API plan.
Do existing custom connectors still work after the rename from Looker Studio?
Yes. Google moved existing reports, data sources and assets over automatically when Looker Studio became Data Studio in April 2026. Connectors built before the rename keep working, and nothing needs to be redeployed because of the name change.
Who owns the connector code if I hire someone to build it?
You should. Ask for the Apps Script project and its deployments to live in a company Google account, with documentation of fields and limits. If the code sits in a contractor's personal account, the report breaks when their access ends.
Keep reading
Related pages
Get started
Tell me what the report has to answer
Send the question your team keeps asking and where the data lives today. I reply within one business day with how I would build it, which connectors it needs and what it would cost.
- Free 30-minute review of your data and reports
- A fixed price before any work starts
- Built in your Google account, so you own everything
Prefer email? harsh@greenwolftechlabs.com
Book a free review
Two lines is enough to start.