Connector guide
Excel to Data Studio: connect your workbooks, keep them fresh and make the totals match
Getting Excel to Data Studio is easier than most guides say: Google has a native Microsoft Excel connector that reads an uploaded .xlsx worksheet, so you need no add-on for a one-off report. This guide is for operations, finance and marketing teams whose numbers still live in Excel workbooks and who want a dashboard people can open in a browser. I cover the four routes, Google's published limits, how to keep the data current, and why the dashboard total so often disagrees with the workbook.
Quick answer
How do I connect Excel to Data Studio?
Create a new data source in Data Studio, pick the Microsoft Excel connector, upload the workbook (up to 100 MB), choose the worksheet and click Connect. The upload is a copy, so for numbers that change weekly convert the file to Google Sheets, or automate exports into a Sheet or BigQuery.
- Data Studio has a native Excel connector; several top-ranking guides still wrongly say it does not.
- An uploaded workbook is a copy, so edits to the original never reach the report on their own.
- One header row, one data type per column and no merged cells fix most failed uploads.
- Recurring Excel exports belong in an automated Sheet or BigQuery table, not repeated manual uploads.
Can you connect Excel to Data Studio directly?
Yes. Google added a Microsoft Excel connector in a release note dated September 26, 2024, saying it lets you access the data stored in an Excel worksheet. It is still in Google's Data Studio documentation today, after the April 2026 rename from Looker Studio back to Data Studio, and it costs nothing to use.
This matters because two of the three pages that rank highest for this search, from Coupler.io and The Bricks, tell readers that Data Studio has no direct Excel integration and that every route must pass through Google Sheets or a paid tool. That was true once. It is not now, and it can push a small team into a subscription it does not need.
The steps are short: sign in, create a data source, choose Microsoft Excel from the Google connectors, upload a workbook or pick one you uploaded before, select the worksheet, set the options and click Connect. The options are the useful part. You can use the first row as headers, include or exclude hidden and filtered cells, and limit the import to a range such as A1:Z26, which is how you skip a title block or a notes column at the edge of a sheet.
What the connector does not do is link to a living file. Google's documentation describes uploading a workbook, and it states plainly that Excel Online spreadsheets are not supported. So a workbook that sits in OneDrive or SharePoint and changes every day cannot be connected as it is. That single fact decides which route below suits you.
What are the ways to get Excel data into Data Studio?
There are four practical routes, and the right one depends on how often the numbers change and how many files feed the report. A workbook that changes once a quarter and a folder of daily exports from an ERP need very different setups.
The native connector suits static or rarely updated data. Converting the workbook to Google Sheets suits files that people keep editing, because Google says Data Studio checks a Sheet for changed values and new rows every time a report queries it. The CSV upload suits repeated exports with an identical layout, because new files are appended to the same dataset. An automated pipeline suits anything that arrives as a stream of files from other systems, such as supplier, insurer or branch reports.
| Route | Freshness | Best for | Main drawback |
|---|---|---|---|
| Native Microsoft Excel connector | Only as fresh as the last upload | One-off analysis, reference tables, quarterly files | No link to OneDrive, SharePoint or Excel Online; someone must re-upload |
| Convert to Google Sheets | Checked on every report query | Workbooks people edit daily or weekly | Formulas, macros and formatting may change on conversion; the Sheet becomes the master copy |
| CSV upload | Updated each time a file is added | Monthly or weekly exports with an identical layout | Files are appended, not merged, so a re-sent month is counted twice |
| Automated pipeline to Sheets or BigQuery | Scheduled, hourly to daily | Many files, messy layouts, several sources or long history | Needs a script or tool built and maintained by someone |
What are the Excel connector's limits?
Google publishes the limits on its Microsoft Excel connector page, and they are generous on size but strict on structure. Most failed uploads I see break a structural rule, not the size limit.
If you route through other formats, their limits apply instead. Google's CSV upload page lists 100 uploads per dataset per day and 1,000 datasets per user, and requires UTF-8 encoding. Google Drive's help page says a spreadsheet created in or converted to Google Sheets can hold up to 20 million cells or 100 MB, and that on import any cell with more than 50,000 characters is removed. Google Sheets is also a flexible-schema source, so a table chart built on it can hold up to 100 dimensions and 100 metrics, far more than the 10 and 20 allowed on GA4 or Google Ads data.
| Limit | What Google's documentation says | What to do about it |
|---|---|---|
| File size | Excel files up to 100 MB | Delete unused sheets and columns, or split history by year |
| Total storage | 2 GB of Excel data sources, 5 GB with Data Studio Pro | Remove old uploads, or move long history to BigQuery |
| Excel Online | Not supported | Export the file, convert to Sheets, or sync it to Drive with a script |
| Password protection | Not supported | Save an unprotected copy for reporting |
| Macros and pivot tables | Not supported | Connect to the flat source table behind the pivot, not the pivot itself |
| Header row | Must be a single row | Merge two-line headers into one row of unique names |
| Column types | All cells in a column should be the same type | Remove totals, notes and N/A text from number and date columns |
How should you prepare an Excel file for Data Studio?
Turn the workbook into one flat table: one header row, one record per row, one kind of value per column. Data Studio does the totals, percentages and charts itself, so anything in the sheet that already summarizes data gets in the way.
Most business workbooks are built for people to read, not for a database to query. They have a title in row 1, a blank row, a two-line header, subtotals after each region and a grand total at the bottom. Every one of those rows becomes a fake record in Data Studio. Work through this checklist before the first upload and keep it with the file for whoever exports it next month.
- Delete title rows and blank rows above the header, or use the range option to start at the header.
- Use one header row with short, unique names, and never rename a column once a report depends on it.
- Unmerge every merged cell and fill the value down, so each row carries its own region or category.
- Remove subtotal and grand total rows; Data Studio will sum the detail rows itself.
- Keep each column to one type: no 'N/A', 'TBC' or dashes in number columns, and real dates rather than text like 'Q3 FY26'.
- Store percentages and rates as the underlying counts too, so they can be recalculated correctly at any level.
- Unhide or delete hidden helper rows, because hidden and filtered cells are included by default.
- Point the connector at the flat data sheet, not at a pivot table or a formatted summary tab.
How do you keep Excel data up to date in Data Studio?
Decide where the master copy lives, then make the report read that copy automatically. Data Studio cannot reach into a laptop or OneDrive, so the question is really how the data gets from Excel to somewhere Data Studio reads on its own.
If people edit the workbook by hand, the simplest fix is to move the editing into Google Sheets. Upload the file to Drive, open it as a Google Sheet and connect it with the Sheets connector. From then on every edit shows up in the report without anyone uploading anything. The trade-off is that the Sheet, not the Excel file, becomes the source of truth, so the team has to agree to stop editing the old copy.
If the workbook is an export from another system that arrives weekly or monthly in the same layout, save it as CSV and add it to a CSV dataset. Google's documentation is clear that uploaded data is appended to existing data, not merged with it, and that each file must have exactly the same fields in the same order. That is convenient for adding one month at a time, and dangerous if someone uploads a corrected March file on top of the original March, because both are now counted. Put the period in a column and check the row count after each upload.
If the files come from several senders, or the layouts drift, automate it. A folder in Google Drive receives the files, an Apps Script or small pipeline reads each one, maps its columns to a standard layout, applies the business rules and writes the result to one Google Sheet or a BigQuery table. Data Studio reads that table. This is more work to set up, but it removes the person who used to spend a morning each month copying and pasting.
Worked example: sizing a monthly Excel reporting setup
Here is how I would size a typical case. Say a distribution business gets one sales workbook a month from each of 6 regions, each with about 8,000 rows and 15 columns, and wants three years of history in one dashboard.
One month is 6 x 8,000 = 48,000 rows, or 720,000 cells at 15 columns. A year is 576,000 rows and 8.6 million cells, which fits comfortably inside Google Sheets' 20 million cell limit. Three years is 1.7 million rows and about 25.9 million cells, which does not fit. The CSV route means 216 separate uploads into an append-only dataset, where one duplicated month quietly inflates every total, which is fragile at this scale. The sensible design is a scheduled load into BigQuery, partitioned by month, with Data Studio reading a summary table so each chart scans only the months on screen.
If the same business only needed the current year, a single Google Sheet fed by a script would be enough, and BigQuery would be overkill. The numbers, not a preference for one tool, should make that decision.
Why don't Data Studio totals match the Excel workbook?
Usually because the workbook and the report count different rows or aggregate differently, not because data went missing. Check these causes in order before rebuilding anything.
A common one is averaging a percentage. If a sheet has a margin column per order, Data Studio's default for that field may be SUM or AVERAGE, and an average of row percentages is not the margin of the total. Build margin as a calculated field, SUM(Profit) / SUM(Revenue), and the figure matches at every level. Another is grouping: when a CASE statement maps product codes to categories, any code the statement misses lands in the ELSE bucket or in null, and that category's total drops.
- Subtotal and total rows left in the data double every figure they cover.
- Hidden or filtered rows are included by default, so rows Excel hid still count in Data Studio.
- Numbers stored as text, often from accounting exports, are read as text and left out of sums.
- Dates stored as text or in mixed formats fall outside the date range control and disappear from charts.
- A re-uploaded CSV month is appended, not replaced, so it is counted twice.
- Percentages and averages need to be rebuilt as ratios of sums in calculated fields.
- Renaming a column in Excel breaks the field in Data Studio, and Google notes that calculated fields that use a removed field are disabled.
When should you move from Excel files to Sheets or BigQuery?
Stay with the native Excel connector when the data changes rarely, one person owns the file and nobody minds a manual upload. A price list, a target table or a one-off analysis for a board meeting fits that description, and a pipeline would be wasted money.
Move to Google Sheets when several people edit the data or the report must reflect changes the same day. Move to BigQuery when history passes the Sheets cell limit, when you need to join the Excel data to GA4, Google Ads, a CRM or an accounting system on customer or order IDs, or when blends start to strain. Data Studio blends hold up to 5 sources with equality joins only, and joining large tables there gets slow quickly.
Do not commission a dashboard at all if the workbook already answers the question and the same two people are the only readers. The value of Excel to Data Studio is shared, current, filterable numbers for people who should not be emailing spreadsheets around. If that is not the problem, keep the spreadsheet.
How I handle Excel to Data Studio projects
I start with a free review of the workbooks, where they come from, who edits them and the decisions the dashboard has to support. Then I recommend the cheapest route that will hold up and quote a fixed price for it.
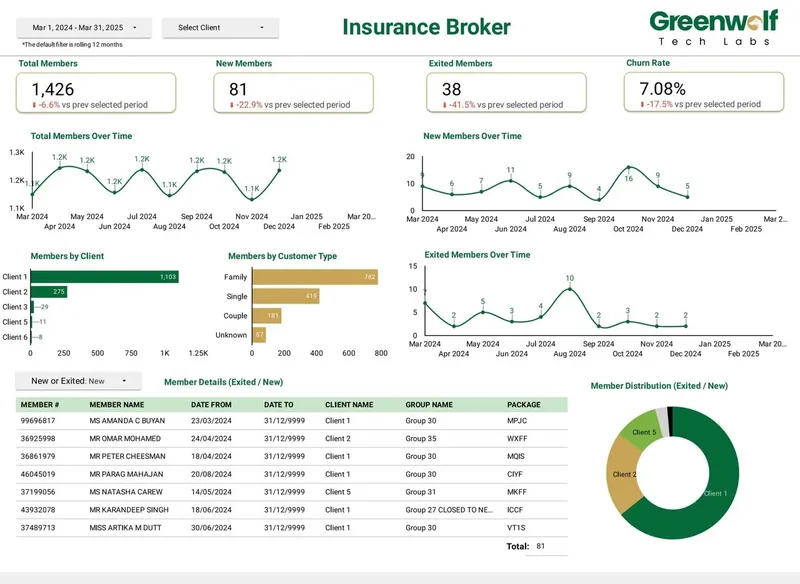
The closest example is a project I led at Greenwolf Tech Labs for an Australian insurance brokerage that received messy .xls files from several insurers. We automated the flow: files land in Google Drive, are mapped into a central Google Sheet, have business rules applied, and feed the dashboard. Report time fell from 4-5 hours to under 5 minutes, and reporting accuracy rose from about 75% to 99%. Visibility across insurers went from limited to real time, with filters.
Every build includes the file preparation rules, the calculated fields for ratios and groupings, a reconciliation of the dashboard against the workbook totals for a recent month, and a handover note so your team can add a month or a column without me. Everything lives in your own Google account from the start.
Case study · Insurance brokerage, Australia
From 4-5 hours of spreadsheet work to a report in under 5 minutes
A project I led at Greenwolf Tech Labs. Monthly reports were assembled by hand from inconsistent .xls files sent by several insurers. The files now land in Google Drive, are mapped into one central sheet with the business rules applied, and feed a Data Studio dashboard.
- Report time: 4-5 hours to under 5 minutes
- Reporting accuracy: about 75% to 99%
- Visibility across insurers: limited to real time, with filters
FAQ
Frequently asked questions
Does Data Studio have a native Excel connector?
Yes. Google's Microsoft Excel connector lets you upload a workbook of up to 100 MB and report on one worksheet, with no add-on or subscription. It does not support Excel Online, password-protected files, macros or pivot tables.
Can I connect an Excel file in OneDrive or SharePoint to Data Studio?
Not directly. Google's documentation says Excel Online spreadsheets are not supported, and the connector works from uploaded files. To keep a OneDrive file current, sync or export it on a schedule into Google Drive, Google Sheets or BigQuery, then connect Data Studio to that copy.
Does Data Studio update when I change my Excel file?
No. The Excel connector reads the copy you uploaded, so changes to the file on your computer or in OneDrive do not appear until you upload again. If the data changes often, convert it to a Google Sheet, which Data Studio checks for changes every time the report queries it.
Is it better to use Google Sheets or the Excel connector?
Use the Excel connector for files that rarely change and one-off reports. Use Google Sheets when people edit the data regularly or several files feed the report, because a Sheet stays current without re-uploading and can be filled automatically by a script.
Why does my Excel upload fail in Data Studio?
The usual causes are a multi-row or merged header, mixed data types in one column, password protection, or pointing at a pivot table. Flatten the sheet to one header row and one record per row, remove totals and text from number columns, and try again.
How big can an Excel file be for Data Studio?
Google's limit is 100 MB per Excel file, with 2 GB of Excel data source storage in total, or 5 GB with Data Studio Pro. Larger or multi-year data is better loaded into BigQuery and reported from there.
Is Excel to Looker Studio the same as Excel to Data Studio?
Yes. Google renamed Looker Studio back to Data Studio in April 2026, and existing reports and data sources moved over automatically. The Microsoft Excel connector and the steps in this guide are the same under either name.
Keep reading
Related pages
Get started
Tell me what the report has to answer
Send the question your team keeps asking and where the data lives today. I reply within one business day with how I would build it, which connectors it needs and what it would cost.
- Free 30-minute review of your data and reports
- A fixed price before any work starts
- Built in your Google account, so you own everything
Prefer email? harsh@greenwolftechlabs.com
Book a free review
Two lines is enough to start.