Connector guide
Airtable to Data Studio: routes, costs and the API limits that break dashboards
Moving Airtable to Data Studio always runs through a third party or a script, because Google has no native Airtable connector and BigQuery's transfer service has no Airtable source. This guide is for operations leads, founders and agencies who run projects, orders or inventory in Airtable and want a dashboard their whole team can read. I compare the four routes with November 2026 prices, then explain the Airtable API limits and field types that cause most broken charts.
Quick answer
How do I connect Airtable to Data Studio?
To connect Airtable to Data Studio, use a partner connector from the Data Studio gallery, an ETL or automation tool that copies Airtable into Google Sheets or BigQuery, a custom script against the Airtable Web API, or CSV exports. There is no native connector. A connector is fastest; Sheets or BigQuery handles linked records and history better.
- Data Studio has no native Airtable connector, so every route depends on a vendor or a script.
- Airtable's API allows 5 requests per second per base and returns 100 records per page.
- Linked records, lookups and multiple selects arrive as arrays that need flattening before charting.
- Free Airtable workspaces get 1,000 API calls a month, which a refreshing dashboard can exhaust.
Does Data Studio have a native Airtable connector?
No. Data Studio's native connectors cover Google products, Google Sheets, BigQuery and databases such as MySQL, PostgreSQL and SQL Server. Airtable is not among them, and the 2026 rename from Looker Studio back to Data Studio did not add one.
BigQuery does not close the gap either. When I checked Google's list of BigQuery Data Transfer Service sources in November 2026, it covered Shopify, Stripe, HubSpot, Salesforce, Mailchimp and others, but not Airtable. That leaves four practical routes: a partner connector, a copy into Sheets, a load into BigQuery through an ETL tool or script, or manual exports.
The right route depends less on the connector and more on how your base is built. A flat table of orders connects easily. A base with linked tables, lookups and rollups needs reshaping before Data Studio can chart it, whichever tool moves the data.
What are the ways to get Airtable data into Data Studio?
Partner connectors from vendors such as Coupler.io and Windsor.ai read an Airtable table or view and expose it as a Data Studio data source. Automation tools such as Make copy records into a Google Sheet when they change or on a schedule, and Data Studio reads the sheet through its free native connector. ETL tools or your own script can load Airtable into BigQuery tables. CSV export from an Airtable view works for a one-off, but someone has to repeat it.
Most of the Airtable bases I see in reporting projects sit somewhere in the middle: a few thousand records, three to six linked tables and a team that edits all day. For those, a scheduled copy into Sheets or BigQuery usually beats a live connector, because it gives you one place to flatten linked records and it keeps API calls predictable.
| Route | Setup time | Handles linked tables | Good fit | Weak spot |
|---|---|---|---|---|
| Partner connector | Under an hour | One view at a time; arrays need splitting | A single flat table or view | Every refresh spends API calls; little control over modelling |
| Automation into Sheets | A few hours | Yes, if you flatten in the sheet | Small bases, frequent edits | Scenario failures go unnoticed; sheets slow with many rows |
| ETL or script into BigQuery | A few days with modelling | Yes, with SQL joins on record IDs | Several linked tables, history, other sources | Needs a Cloud project and someone who writes SQL |
| CSV export | Minutes, every time | Only what the view shows | A one-off review | Not a reporting system |
How much does an Airtable to Data Studio connector cost?
Entry plans run from free to about $32 a month, plus whatever your Airtable plan costs. I read these prices on the vendors' own pricing pages in November 2026; they change, so confirm before buying.
Count your Airtable plan as part of the cost. Airtable's support documentation lists 1,000 API calls per workspace per month on the Free plan, 100,000 on Team and unlimited on Business. A connector that pulls 5,000 records needs at least 50 calls per refresh, because the API returns 100 records per page, so a free workspace refreshed hourly runs out within a day. Team is $20 per user per month and Business $45 per user per month, both billed annually, according to Airtable's pricing page.
| Tool | Free option | Entry paid plan (November 2026) | What the entry plan includes |
|---|---|---|---|
| Coupler.io | Free: 1 account, 100 rows per run, manual refresh | Starter: $32 a month billed monthly, $24 a month billed annually | 3 accounts, daily refresh |
| Windsor.ai | Forever free after trial: 1 user, 1 data source, 1 account | Basic: $23 a month billed monthly, $19 a month billed annually | 3 data sources, 75 accounts |
| Make into Sheets | Check Make's current plans | Usage-based; confirm on Make's pricing page | Flexible, but you build and monitor the scenario |
| Custom script into Sheets or BigQuery | No licence cost | Your build and maintenance time | Full control over flattening and schedule |
What Airtable API limits break Data Studio reports?
Every connector and script reads Airtable through the same Web API, so its limits apply whichever tool you choose. These come from Airtable's developer documentation, read in November 2026.
The API allows 5 requests per second per base, and 50 requests per second across all traffic from one user's or service account's personal access tokens. Exceed it and Airtable returns a 429 error, after which you must wait 30 seconds before requests succeed again. List requests return at most 100 records per page, with an offset to fetch the next page. A 20,000-record table therefore needs 200 requests per full refresh, which takes time even at full speed and can collide with other integrations hitting the same base.
Plan caps matter too. Airtable lists 1,000 records per base on Free, 50,000 on Team and 125,000 on Business. Bases near those caps usually have years of closed records that the dashboard still needs, which is a strong reason to archive history to BigQuery rather than keep everything in Airtable.
| Airtable limit | What you see in Data Studio | Fix |
|---|---|---|
| 5 requests per second per base | Slow refreshes, timeouts on large tables | Pull on a schedule into Sheets or BigQuery, not on every chart load |
| 429 error then 30-second wait | Partial data or connector errors | Stagger integrations; avoid several tools refreshing at once |
| 100 records per page | Large tables take minutes to load | Use a filtered view or incremental loads by last modified time |
| API calls per workspace per month | Connector stops mid-month on Free | Refresh less often or move to a plan with more calls |
| Records per base by plan | Old records deleted to stay under the cap | Archive closed records to BigQuery and report from there |
Why do Airtable linked records and lookups break Data Studio charts?
Because Airtable returns them as lists and Data Studio expects one value per cell. Airtable's field documentation says linked record fields return an array of record IDs, lookups return an array of values, and multiple select fields return an array of option names. A connector either turns those arrays into a comma-separated string or drops them, and neither charts well.
Take a project base where each task links to a client and carries two tags. In Data Studio, a bar chart of tasks by tag shows a bar for 'Design, Urgent' rather than one for each tag, and a filter on client name finds nothing if the field holds record IDs such as recXXXX instead of names. The fix is to reshape before the data reaches Data Studio.
- Linked records: export the linked table separately and join on record ID in BigQuery or with a lookup in Sheets, or add a formula field in Airtable that returns the linked name as text.
- Multiple selects: split into one row per value in a separate table, or add yes/no fields for the handful of tags that matter.
- Lookups and rollups: prefer a rollup that returns a single number (sum, count, max) over a lookup that returns a list.
- Attachments: Airtable says attachment URLs expire 2 hours after the API returns them, so image charts break. Host images elsewhere if they must appear in the report.
- Dates: set an explicit time zone on date fields so day boundaries match Data Studio's date range.
How do you connect Airtable to Data Studio step by step?
With a connector the clicks take fifteen minutes. These steps include the decisions that keep the report working after the first week.
Ownership matters as much as the tool. Data Studio data sources run on the owner's credentials by default, so viewers do not need Airtable seats. If the personal access token belongs to someone who later leaves, the data stops and Data Studio sends no warning. Create the token from a shared admin or service account, give it read-only scopes on only the bases the report needs, and record where it is used.
- Create a dedicated reporting view in each table with only the fields and records the dashboard needs.
- Add formula fields for linked names, a clean status, and a single numeric value per record.
- Create a read-only personal access token from a shared account, scoped to the reporting bases.
- Choose the route: connector for one flat view, Sheets or BigQuery for linked tables or history.
- In Data Studio, add the data source, set field types (date, number, currency) and check aggregation on each metric.
- Reconcile record counts and totals against the Airtable view before sharing the report.
- Set a refresh schedule that fits your API call allowance, and a weekly check that counts still match.
Should Airtable data go through Google Sheets or BigQuery?
Use Google Sheets when the base has a few thousand records, the team is comfortable checking a sheet, and the dashboard mainly counts and sums by status, owner and date. Sheets is free and gives you a visible place to flatten linked fields. My Google Sheets to Data Studio guide covers how to structure the sheet so charts do not break when someone edits a column.
Use BigQuery when you have several linked tables, need history after records are archived, or want Airtable beside other sources such as GA4, a CRM or finance data. Load each table separately, join on record ID in a view, partition large tables by date, and point Data Studio at the view. Blends in Data Studio take at most 5 sources and only equality joins, so modelling in SQL is far more reliable for a multi-table base.
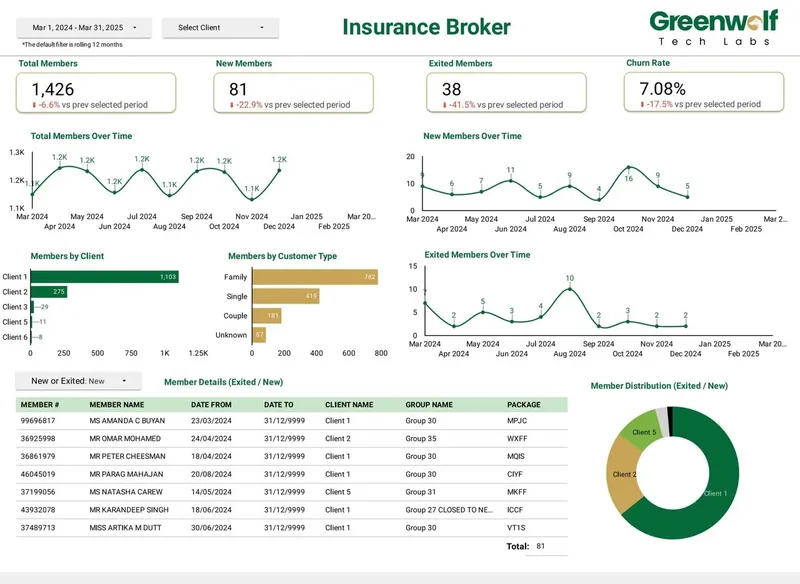
This is the same pattern I used for an Australian insurance brokerage at Greenwolf Tech Labs, where messy insurer files were mapped into one central Google Sheet with business rules before reaching Data Studio. Report time fell from 4 to 5 hours to under 5 minutes, and reporting accuracy rose from about 75% to 99%. The lesson carries over to Airtable: clean, flat data in the middle layer is what makes the dashboard dependable.
What can an Airtable dashboard in Data Studio show?
Airtable usually holds operational data, so the best dashboards answer operational questions: what is stuck, who owns it, and how long things take. Status counts, ageing by stage, workload by owner and throughput per week all work well once the fields are flat.
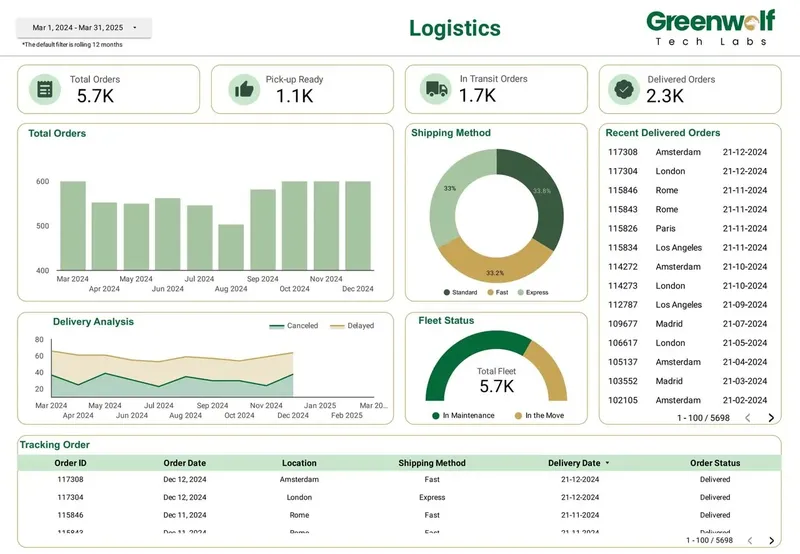
A logistics dashboard I have built at Greenwolf Tech Labs shows the shape of this: orders by stage (pickup ready, in transit, delivered), shipping method mix, cancelled and delayed deliveries, fleet status and an order tracking table. Many teams track the same stages in an Airtable base. Data Studio adds filters, date comparisons, scheduled email delivery and access for people who do not have an Airtable seat.
When should you hire help for Airtable reporting, and when not?
Do it yourself if you report from one flat table, need counts and sums by status, and your API allowance covers the refresh. A connector's free or entry plan, or a CSV for a monthly review, is enough. Paying anyone would be wasted money.
Bring in help when the base has linked tables the report depends on, when Airtable must sit beside other systems, when you need history after records are archived, or when the report must keep working after its builder moves on. Those are data modelling problems, not connector problems.
When I take on an Airtable to Data Studio project, I start with a free review of your base, the decisions the report supports and any existing reports. I recommend the cheapest route that will hold up, often Sheets, and quote a fixed price. Reports, data sources and any helper sheets or BigQuery tables sit in your accounts from the start.
Case study · Insurance brokerage, Australia
From 4-5 hours of spreadsheet work to a report in under 5 minutes
A project I led at Greenwolf Tech Labs. Monthly reports were assembled by hand from inconsistent .xls files sent by several insurers. The files now land in Google Drive, are mapped into one central sheet with the business rules applied, and feed a Data Studio dashboard.
- Report time: 4-5 hours to under 5 minutes
- Reporting accuracy: about 75% to 99%
- Visibility across insurers: limited to real time, with filters
FAQ
Frequently asked questions
Can I connect Airtable to Data Studio for free?
Yes, for small bases. You can copy Airtable into a Google Sheet with a free automation or script and read it with Data Studio's free Sheets connector, or use a vendor's free plan such as Windsor.ai's forever free tier with 1 data source and 1 account. Watch your Airtable API call allowance on the Free plan.
Is there a native Airtable connector in Data Studio?
No. Data Studio's native connectors cover Google products, Sheets, BigQuery and several databases. Airtable needs a partner connector, a copy into Sheets or BigQuery, a custom script, or CSV uploads.
Why does my Airtable data show record IDs in Data Studio?
Linked record fields return an array of record IDs through Airtable's API. Add a formula or lookup field in Airtable that returns the linked name as text, or join the linked table on record ID in Sheets or BigQuery before charting.
How often can Data Studio refresh Airtable data?
It depends on the route and your Airtable plan. The API allows 5 requests per second per base and returns 100 records per page, and Free workspaces get 1,000 API calls a month. Daily or hourly scheduled copies usually work better than live queries on every chart load.
Why are my Airtable images missing from the Data Studio report?
Airtable's documentation says attachment URLs expire 2 hours after the API returns them. An image that loaded at refresh time breaks later. Host images in a permanent location if they need to appear in the report.
Can I combine Airtable with other data in Data Studio?
Yes. For simple cases, blend on a shared key such as date or client ID, within Data Studio's limit of 5 sources and equality joins. For several tables or sources, load everything into BigQuery and report from one view.
Should I use Airtable Interfaces or Data Studio for dashboards?
Airtable Interfaces suit people who already work in the base and need to edit records. Data Studio suits read-only reporting for wider audiences, scheduled email delivery and combining Airtable with sources outside it.
Keep reading
Related pages
Get started
Tell me what the report has to answer
Send the question your team keeps asking and where the data lives today. I reply within one business day with how I would build it, which connectors it needs and what it would cost.
- Free 30-minute review of your data and reports
- A fixed price before any work starts
- Built in your Google account, so you own everything
Prefer email? harsh@greenwolftechlabs.com
Book a free review
Two lines is enough to start.