Connector guide
Amazon Seller Central to Data Studio: routes, costs and the API rules behind the numbers
Getting Amazon Seller Central to Data Studio always needs a third party or your own code, because Google offers no native Amazon connector and its BigQuery transfer service has no Amazon source. This guide is for ecommerce founders, marketplace managers and finance leads who want Amazon sales, traffic and fees in one report beside their own store and ad spend. I compare the four routes with their November 2026 prices, then explain the Selling Partner API rules that decide what your report can and cannot show.
Quick answer
How do I connect Amazon Seller Central to Data Studio?
To connect Amazon Seller Central to Data Studio, use a partner connector from the Data Studio gallery, an ETL tool that loads Seller Central reports into Google Sheets or BigQuery, a custom script against Amazon's Selling Partner API, or manual report downloads. There is no native connector. A partner connector is fastest; BigQuery suits several marketplaces and long trends.
- Data Studio has no native Amazon connector, and BigQuery Data Transfer Service has no Amazon source.
- Amazon's Sales and Traffic report cannot start more than two years before the request date.
- Ordered product sales and settlement payouts measure different things and will never match exactly.
- Entry connector plans run from free to $49 a month, priced by sources and accounts.
Does Data Studio have a native Amazon Seller Central connector?
No. Data Studio's built-in connectors cover Google products (GA4, Google Ads, Search Console, YouTube, Campaign Manager 360, Display and Video 360, Ad Manager), Google Sheets, BigQuery and a handful of databases such as MySQL, PostgreSQL and SQL Server. Amazon is not on that list, and the April 2026 rename from Looker Studio back to Data Studio changed nothing about connectors.
The warehouse route has the same gap. When I checked Google's list of BigQuery Data Transfer Service sources in November 2026, it included Shopify, Stripe, PayPal, Facebook Ads, Klaviyo and Mailchimp, but no Amazon source of any kind. So every Amazon Seller Central to Data Studio setup depends on a partner connector, an ETL vendor or code you maintain yourself.
Partner connectors do exist in the gallery. Google's Data Studio release notes recorded Amazon Seller Central and Amazon Ads connectors by Adzviser on August 21, 2025, and vendors such as Windsor.ai, Supermetrics, Porter Metrics, Coupler.io and Improvado publish their own Seller Central integrations. The question is which one fits your marketplaces, your history needs and your budget.
What are the ways to get Amazon Seller Central data into Data Studio?
There are four routes, and they differ in setup time, how much history you keep and how well Amazon data joins to your other channels. A single-marketplace seller checking weekly sales needs something very different from a brand selling in the US, UK and Germany beside its own Shopify store.
A partner connector queries Amazon (or the vendor's cached copy) when charts load. An ETL tool runs Seller Central reports on a schedule and writes the rows to a Google Sheet or BigQuery table, which Data Studio then reads with a free native connector. A custom script calls the Selling Partner API directly, usually from Apps Script, Cloud Functions or Python. Manual download means exporting Business Reports from Seller Central and uploading the file.
| Route | Setup time | History you keep | Good fit | Weak spot |
|---|---|---|---|---|
| Partner connector | Under an hour | Whatever the API and vendor still serve | One marketplace, quick sales and traffic view | Fees rise with marketplaces; limited control over definitions |
| ETL into Sheets | A few hours | Everything pulled so far | Small catalogs, simple weekly reporting | Sheets slows down with daily rows per ASIN |
| ETL into BigQuery | A few days with modelling | Everything loaded, kept indefinitely | Several marketplaces, Shopify plus Amazon, multi-year trends | Needs a Cloud project and SQL views |
| Custom SP-API script | One to three weeks | Whatever you store | Unusual reports, strict data control | You own throttling, token refresh and every Amazon API change |
| Manual download | Minutes, every time | Only what someone saved | A one-off board slide | Not a reporting system |
How much does an Amazon Seller Central connector for Data Studio cost?
Entry plans run from free to about $49 a month. I read the prices below on each vendor's own pricing or connector page in November 2026; they change often, so confirm before you buy.
Two things decide the real bill. First, vendors count each Amazon marketplace or seller account as an account, so a seller in three regions can outgrow an entry plan on day one. Second, most entry plans cap the number of data sources, and Amazon Ads usually counts as a separate source from Seller Central. Google Ads and GA4 never need a paid connector, so count only the non-Google platforms when you size a plan.
| Vendor | Free option | Entry paid plan (November 2026) | What the entry plan includes |
|---|---|---|---|
| Windsor.ai | Forever free after trial: 1 user, 1 data source, 1 account | Basic: $23 a month billed monthly, $19 a month billed annually | 3 data sources, 75 accounts |
| Coupler.io | Free: 1 account, 100 rows per run, manual refresh | Starter: $32 a month billed monthly, $24 a month billed annually | 3 accounts, daily refresh |
| Supermetrics | No free plan; trial only | Starter: $49 a month billed monthly, $39 a month billed annually | 2 data sources, 2 accounts per source; check Seller Central is available on your tier |
| Porter Metrics | Free plan advertised | From $15 a month, priced per Seller Central account | Check field coverage and refresh with the vendor |
What Selling Partner API rules break Amazon reports in Data Studio?
Every connector reads Amazon through the same Selling Partner API (SP-API), so its rules apply whichever vendor you pick. The figures here come from Amazon's SP-API developer documentation, which I read in November 2026.
The Sales and Traffic report is the source of most dashboard metrics: ordered product sales, units ordered, sessions, page views and Buy Box percentage, by day, week or month. Amazon states that the report's start date must not be more than two years before the date of the request. A connector that pulls live from the API can therefore never show you a three-year trend unless someone stored the older rows. The report can be requested up to three times every five minutes, and requests beyond that are refused, which is why large accounts with many ASINs see slow or partial refreshes.
Access is role based. The Sales and Traffic report needs the Brand Analytics role, and Amazon's Brand Analytics reports (search query performance, market basket, repeat purchase) also need Brand Registry. Buyer names and addresses are restricted personal data: operations such as getOrderBuyerInfo need a Restricted Data Token and a restricted role. Most reporting connectors do not request that access, and for a sales dashboard you should not want them to.
Settlement reports work differently again. Amazon's documentation says they are scheduled automatically by Amazon and cannot be requested or scheduled by you, so a connector can only fetch the ones that already exist. Finally, Amazon is moving reporting to Data Kiosk, a GraphQL API, and states that Reports API reports will be deprecated after they are onboarded to it. Vendors handle that switch for you; a home-built script will need rewriting.
| Amazon rule | What you see in Data Studio | Fix |
|---|---|---|
| Sales and Traffic start date within two years | Year-on-year charts stop at two years | Store daily rows in BigQuery from now on |
| Three report requests per five minutes | Slow refreshes or missing marketplaces | Pull once a day into a table instead of live queries |
| Brand Analytics role needed | Traffic fields empty or connector errors | Grant the role to the app in Seller Central |
| Settlements scheduled by Amazon only | Latest payout missing for days | Report payouts by settlement period, not by calendar day |
| Buyer PII restricted | No customer names or addresses | Report on orders and ASINs; keep PII out of dashboards |
Why don't Amazon numbers in Data Studio match Seller Central?
Usually because the report and Seller Central are answering different questions. Ordered product sales counts sales when customers order. Settlement reports record what Amazon actually pays out for a settlement period, after fees, refunds and reimbursements, using the general-purpose amount-type, amount-description and amount columns. A chart that mixes the two will never reconcile, and that is the most common complaint I hear from finance teams about Amazon dashboards.
Work through these checks before blaming the connector.
- Definition: are you comparing ordered product sales against a payout figure? Pick one per chart and label it.
- Marketplace and currency: summing US dollars, pounds and euros across marketplaces gives a meaningless total; convert or split by marketplace.
- Date basis: Seller Central Business Reports, settlement periods and Data Studio's date range can cut days differently.
- Granularity: week and month requests expand to full calendar weeks (Sunday to Saturday) and months, so a partial range returns extra days.
- Late changes: cancellations, refunds and returns arrive after the order, so recent days move for a while.
- B2B: Amazon reports B2B sales as separate fields; check whether your total includes them.
- Missing accounts: a new marketplace that was never added to the data source shows as zero, not as an error.
Which Amazon Seller Central metrics should the dashboard show?
Start with five numbers per marketplace: ordered product sales, units ordered, sessions, unit session percentage (Amazon's conversion rate) and Buy Box percentage. Those all come from the Sales and Traffic report, so they share one definition and one refresh.
Add profit only when you have the data for it. Margin needs settlement fees plus your own product costs, which usually live in a Google Sheet the finance team keeps. Join them by SKU in BigQuery or Sheets, not with a Data Studio blend, because blends take at most 5 data sources and only equality joins, and Amazon SKUs rarely match internal codes without a mapping table.
Keep advertising on its own page unless the data is modelled together. Amazon Ads is a separate API with its own attribution, which I cover in the Amazon Ads to Data Studio guide. A TACoS chart (ad spend divided by total sales) is worth building, but only once both feeds sit in the same table with matching dates and marketplaces.
| Metric | Source | Watch out for |
|---|---|---|
| Ordered product sales | Sales and Traffic report | Order-time value, not cash received |
| Units ordered | Sales and Traffic report | Counted at order time; track refunds and returns separately |
| Sessions and page views | Sales and Traffic report | Browser and mobile app are reported separately |
| Unit session percentage | Sales and Traffic report | Average with care; never sum percentages |
| Buy Box percentage | Sales and Traffic report | Meaningful per ASIN, misleading as an account average |
| Net payout | Settlement report | Arrives per settlement period scheduled by Amazon |
How do you connect Amazon Seller Central to Data Studio step by step?
The clicks take fifteen minutes with a partner connector. The decisions around them are what keep the report working next year.
The most important decision is whose login authorises the connector. Data Studio data sources run on the owner's credentials by default, which is why viewers do not need Seller Central access. If the authorising user is a former agency contact or an employee who leaves, the data stops and Data Studio does not warn anyone. Use a company-owned Seller Central user with the right permissions, and write down who it is.
- List marketplaces and accounts first, then size the connector plan against that count.
- In Data Studio, create a data source, search the gallery for your vendor, and sign in to the vendor.
- Authorise the app in Seller Central with a company-owned user; confirm the Brand Analytics role if you need traffic metrics.
- Create one data source per report type (sales and traffic, orders, settlements, inventory) rather than one giant source.
- Add a calculated field that maps marketplace to currency, and a CASE statement for region if you sell in several.
- Reconcile last month's ordered product sales by marketplace with Seller Central Business Reports before sharing.
- Set scheduled email delivery for the people who only need the weekly numbers.
When should Amazon data go through BigQuery?
Use BigQuery when you need more than two years of sales and traffic history, sell in several marketplaces, or want Amazon beside Shopify, WooCommerce and ad spend in one model. Stay with a connector if you run one marketplace and report on the current year.
Because Google's transfer service has no Amazon source, the load runs through an ETL vendor or your own code. Load daily sales and traffic by ASIN, settlements, and inventory as separate tables, partition them by date, and build one summary view with the columns the report needs. Point Data Studio at the view, not the raw tables, so queries stay small and fast.
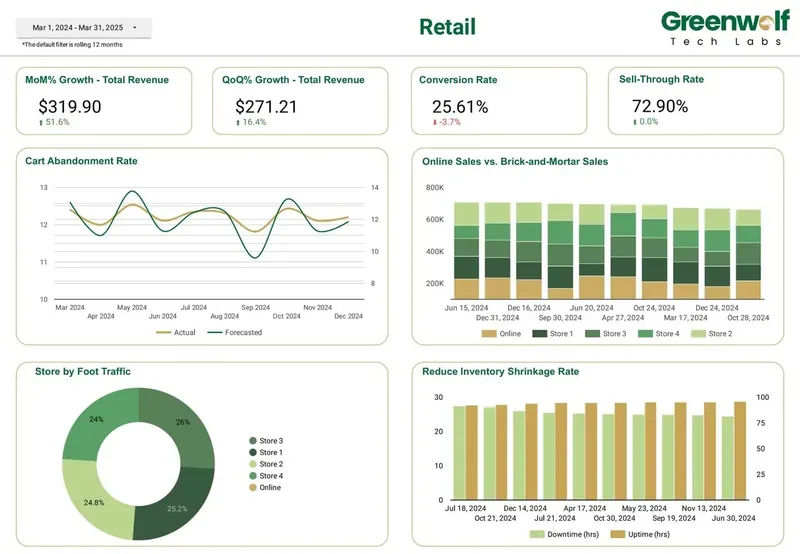
This is the pattern behind retail dashboards I have built at Greenwolf Tech Labs: month-on-month and quarter-on-quarter revenue growth, conversion rate, sell-through rate and online versus in-store sales on one page. The visible charts are the easy part. Most of the work is agreeing one definition of revenue across channels and mapping product codes so they line up.
When should you hire help for Amazon Seller Central reporting, and when not?
Do it yourself if you sell in one marketplace, want sales and traffic by ASIN, and are happy with a vendor template. A free or entry connector plan and an afternoon is the right spend, and hiring anyone would be wasted money.
Bring in help when Amazon must sit beside your own store and ad platforms, when finance needs margin after fees, when you need history beyond Amazon's two-year window, or when the report must survive the person who built it. Those are modelling problems more than connector problems.
When I take on an Amazon Seller Central to Data Studio project, I start with a free review of your marketplaces, the decisions the report supports and any reports you already have. I recommend the cheapest route that will hold up, often a connector you already pay for, and quote a fixed price for the build. Reports, data sources and any BigQuery tables live in your accounts from day one.
FAQ
Frequently asked questions
Can I connect Amazon Seller Central to Data Studio for free?
Yes, for a single account. Windsor.ai keeps a forever free plan after its trial with 1 user, 1 data source and 1 account, and Coupler.io has a free plan limited to 100 rows per run with manual refresh. Manual Business Report downloads also cost nothing but must be repeated by hand.
Is there a native Amazon connector in Data Studio?
No. Data Studio's native connectors cover Google products, Sheets, BigQuery and several databases. Amazon Seller Central needs a partner connector, an ETL tool into Sheets or BigQuery, a custom Selling Partner API script, or file uploads.
How far back can I report Amazon sales and traffic in Data Studio?
Amazon's documentation says the Sales and Traffic report cannot start more than two years before the request date. A connector that queries live will stop at that point. To keep longer trends, load the data into BigQuery or a Sheet and keep adding to it.
Why is my Amazon revenue in Data Studio different from my payouts?
Ordered product sales count sales at order time, while settlement reports show what Amazon pays after fees, refunds and reimbursements for each settlement period. They measure different things, so show them on separate charts with clear labels.
Can I show Amazon and Shopify sales in one Data Studio report?
Yes. Load both into one table with matching columns such as date, channel, SKU, units and revenue, then report from that table. Avoid blending live connectors on SKU, since blends allow at most 5 sources and only equality joins.
Can Data Studio show Amazon customer names and addresses?
Usually not, and it should not need to. Amazon treats buyer details as restricted data that requires a Restricted Data Token and a restricted role. Sales dashboards work at order, ASIN and marketplace level instead.
Do I need a separate connector for each Amazon marketplace?
Not a separate tool, but most vendors count each marketplace or seller account as an account on your plan. Count your marketplaces before choosing a tier, and keep currencies separate in the report.
Keep reading
Related pages
Get started
Tell me what the report has to answer
Send the question your team keeps asking and where the data lives today. I reply within one business day with how I would build it, which connectors it needs and what it would cost.
- Free 30-minute review of your data and reports
- A fixed price before any work starts
- Built in your Google account, so you own everything
Prefer email? harsh@greenwolftechlabs.com
Book a free review
Two lines is enough to start.