Connector guide
NetSuite to Data Studio: which route to use, what Oracle limits, and how to make the numbers tie
Getting NetSuite to Data Studio always needs a partner connector, a pipeline into BigQuery or a Google Sheet, or exported saved searches, because Google ships no native NetSuite connector. This guide is for CFOs, controllers, finance analysts and founders who want revenue, margin, receivables and spend from NetSuite beside sales or marketing data in one report. I compare five routes, explain the Oracle limits that decide between them, and show why a Data Studio P&L built on NetSuite rarely matches the financial report on the first try.

Quick answer
How do I connect NetSuite to Data Studio?
NetSuite to Data Studio has no native connector, so you use a partner connector from the gallery, a scheduled pipeline that copies NetSuite into BigQuery, a tool that writes NetSuite data into a Google Sheet, or exported saved searches. Connectors suit one subsidiary and simple views; BigQuery suits multi-subsidiary history, large transaction tables and joins with CRM data.
- Google offers no native NetSuite connector, so every route depends on a vendor or a pipeline.
- SuiteQL over REST returns at most 100,000 results; larger pulls belong on SuiteAnalytics Connect.
- Most mismatches come from subsidiaries, currencies, posting periods and account mapping, not lost rows.
- Use a business-owned integration role, never a person's login, or the report dies when they leave.
Can you connect NetSuite to Data Studio directly?
No. Data Studio's native connectors cover Google products and a set of databases: GA4, Google Ads, Search Console, Sheets, BigQuery, YouTube, Campaign Manager 360, Display and Video 360, Ad Manager, Cloud SQL, MySQL, PostgreSQL, SQL Server and Redshift. NetSuite is not on that list, and the April 2026 rename from Looker Studio back to Data Studio did not change it.
So NetSuite data reaches a report in one of two ways. Either a partner connector in the Data Studio connector gallery queries NetSuite, or a copy of it, when a chart loads. Or the data lands first in somewhere Data Studio already reads natively, usually BigQuery or a Google Sheet, and the report reads that copy. The second pattern is more work up front and far more reliable for finance reporting, because you control how transactions, accounts and subsidiaries are modelled before anyone sees a chart.
What are the five ways to get NetSuite data into Data Studio?
Each route trades setup speed against row volume, freshness and control. Pick based on how many subsidiaries you report on, how many transaction lines you have, how far back the history must go, and whether NetSuite has to sit beside CRM, ecommerce or ad data in the same table.
Vendors that rank for this search include Windsor.ai, Coupler.io, Improvado, Skyvia, CData Connect Cloud, Coefficient and Peliqan. Coupler.io's NetSuite page, read in November 2026, describes token-based authentication with a realm, consumer key and secret, and token key and secret, 104 exportable NetSuite data types, optional SuiteQL queries, and refresh schedules from every 15 minutes to monthly. Skyvia describes replicating NetSuite into a warehouse and pointing Data Studio at that. Fivetran has published the same warehouse pattern using BigQuery. None of the vendor pages I read list a NetSuite-specific price, so price your real plan with each vendor directly.
| Route | How it works | Best for | Main drawback |
|---|---|---|---|
| Partner connector | A gallery connector queries NetSuite or the vendor's cache when charts load | One subsidiary, a handful of standard views, quick start | The vendor decides how records are flattened; slow on large transaction tables |
| Sync to Google Sheets | A tool writes NetSuite records or SuiteQL results into a Sheet on a schedule | Small volumes, budget-vs-actual work, finance teams who live in Sheets | Sheets slows as rows grow, and an edited tab can break the report |
| Pipeline to BigQuery | A sync tool or script copies NetSuite tables into BigQuery; Data Studio reads views | Several subsidiaries, multi-year history, joins with CRM or ecommerce | Needs a Google Cloud project and someone to write and maintain SQL |
| SuiteAnalytics Connect | ODBC, JDBC or ADO.NET drivers read the NetSuite2.com data source into your warehouse | Large extracts beyond REST limits, full table replication | Must be enabled on your account and needs a host to run the driver |
| Saved search export | Someone exports a saved search to CSV and loads it into a Sheet | A one-off board pack or a proof of concept | Stale the moment it is saved, and versions drift between people |
What NetSuite limits decide which route you need?
Two Oracle facts shape the decision more than any vendor feature list. Both come from Oracle's NetSuite documentation, read on November 4, 2026.
First, SuiteQL queries sent through REST web services can return a maximum of 100,000 results. The endpoint is a POST to /services/rest/query/v1/suiteql with a Prefer: transient header, and results come back in pages using limit and offset. Oracle's own guidance is that if you expect more than 100,000 results, you should use SuiteAnalytics Connect with the NetSuite2.com data source instead. A mid-size company's transaction lines pass that number quickly, so a connector built only on SuiteQL will need to pull history in date windows, which is why Coupler.io exposes a window-in-days setting for large datasets.
Second, SuiteAnalytics Connect is a read-only service that works through ODBC, JDBC and ADO.NET drivers, and Oracle describes it as something your company enables. As of NetSuite 2026.1, the older NetSuite.com data source is no longer available and NetSuite2.com is the only Connect data source. Oracle says NetSuite2.com applies role-based access control and is designed to show data consistent with SuiteAnalytics Workbook. If any older pipeline you inherited still points at NetSuite.com, it has already stopped working.
For authentication over REST, Oracle supports token-based authentication and OAuth 2.0. Tokens are not affected by password rotation policies, which is exactly what you want behind a report that should keep refreshing for years.
Which NetSuite to Data Studio route should you choose?
Choose by volume and complexity, not by how fast the demo looked. A short decision rule covers most finance teams I speak to.
- One subsidiary, one currency, fewer than a few thousand transactions a month, and simple views: start with a partner connector or a Sheets sync.
- Several subsidiaries or currencies: use BigQuery, because consolidation logic belongs in SQL views, not in report-level calculated fields.
- Transaction history that passes the 100,000 result cap: use SuiteAnalytics Connect or a sync tool that pages through history in date windows.
- NetSuite beside HubSpot, Salesforce, Shopify or ad spend: use BigQuery and build one table keyed on customer and month.
- A one-off board pack or a test of whether anyone will use the dashboard: export a saved search and prove the value first.
Why don't NetSuite numbers in Data Studio match NetSuite's reports?
Usually because NetSuite's financial reports apply rules at run time that a raw transaction table does not. The income statement applies posting periods, account types, subsidiary consolidation and currency translation. A table of transaction lines applies none of that until you model it.
A worked example shows the most common trap. Say a UK subsidiary books a GBP 10,000 invoice and the parent reports in US dollars. NetSuite's consolidated income statement translates that amount into the parent currency using its consolidated exchange rates. If the Data Studio chart sums the transaction amount field, it adds 10,000 pounds to dollar figures from the US entity, and revenue is wrong before anyone looks at a chart. Model the parent-currency amount once in a BigQuery view, label it, and use only that field in charts.
Work through these causes in order before blaming the connector.
- Subsidiaries: a consolidated total needs eliminations and the right subsidiary hierarchy; summing all rows double counts intercompany activity.
- Currency: use the parent or reporting currency amount, not the transaction currency amount.
- Posting period versus transaction date: NetSuite reports by accounting period; a chart by transaction date moves late postings into a different month.
- Posting versus non-posting lines: sales orders and estimates are not revenue; filter to posting transactions for financial views.
- Account mapping: group accounts by type and your management lines in one lookup, not in each chart.
- Signs: income and expense can arrive with opposite signs; flip them in one calculated field so totals net correctly.
- Role permissions: the integration role may not see every subsidiary or record type, so rows are silently missing.
- Snapshot timing: a pull made on the 3rd misses adjustments posted on the 10th for a period that was still open.
What should a NetSuite dashboard in Data Studio include?
Build it around the questions finance leaders ask every week: are we hitting plan, where is margin moving, who owes us money and how much cash will we have. CFO and finance dashboards from projects I've led at Greenwolf Tech Labs follow that idea: cash, revenue, spend and margin in one view for finance leaders.
A good first version fits on four or five pages. Page one is the income statement by month and by subsidiary, against budget and last year, with the reporting currency stated in the header. Page two is revenue and gross margin by customer, item and class or department. Page three is receivables: open and overdue invoices in 0-30, 31-60, 61-90 and 90+ day buckets. Page four is payables and spend by vendor and category. Page five, if the business needs it, is inventory or order backlog.
In Data Studio itself, use a parameter for budget scenario if you keep more than one, a CASE statement in BigQuery or a calculated field to map accounts into the eight to ten lines management reads, and filter controls for subsidiary, department and class. Set data source credentials to the owner's so a sales director can see revenue without a NetSuite login, and restrict pages by audience. Blends are limited to 5 sources and equality joins only, so cross-system views belong in one prepared table rather than stacked blends. Flexible-schema sources such as BigQuery allow up to 100 dimensions and 100 metrics in a table, which is plenty for a detailed ledger view.
How do you connect NetSuite to Data Studio step by step?
The clicks take an afternoon. The steps that keep the numbers trusted after each close take longer, so they are part of the list.
Data Studio gives no warning when a connector stops working. If the NetSuite tokens belong to an employee or contractor whose access ends, every chart goes blank without an alert, so connect through a dedicated integration role and check the report after every close.
- Agree the numbers: list each figure leadership reviews and define it, for example revenue, posting transactions only, by accounting period, in reporting currency.
- Create an integration record and a dedicated role in NetSuite with read access to exactly the record types and subsidiaries the report needs.
- Authenticate with token-based authentication or OAuth 2.0, owned by the business, not a person.
- Choose the route from the decision rules above, and pull history in date windows if volume passes the REST result cap.
- Land the data in BigQuery or a Sheet, partition large BigQuery tables by date, and build one view per reporting need.
- Map accounts, subsidiaries and currency once in that view, then build the Data Studio pages on top.
- Reconcile last closed month against NetSuite's income statement and aging reports with the same subsidiary, period and currency, to the cent.
- Share the report, not the data source, and schedule an email delivery for the day after close.
When is NetSuite to Data Studio not worth it?
If NetSuite is your only source and the people who need the numbers already have NetSuite access, its saved searches, financial reports and SuiteAnalytics Workbook may be enough. Moving data out adds a pipeline, a model and something to maintain each time the chart of accounts or subsidiary structure changes.
Good reasons to do it: finance must sit beside CRM, ecommerce or marketing data; people who need the numbers should not get NetSuite licences or roles; the board wants trends and history in a layout NetSuite does not give; or several systems need one shared definition of revenue. Weak reasons: a nicer chart style, or rebuilding a NetSuite report that already works.
Data Studio itself costs nothing to build and view reports. If your team needs organization-owned content and team workspaces, Data Studio Pro is $9 per user per project per month, and viewers need no licence. Your other running costs are the connector or sync tool, BigQuery storage and queries, and SuiteAnalytics Connect if you use it.
How I handle NetSuite to Data Studio projects
I start with a free review of your NetSuite setup: subsidiaries, currencies, the record types involved, the saved searches people already trust and the questions the report must answer. I recommend the cheapest route that will hold up, often a sync tool you already pay for plus a BigQuery model, and quote a fixed price.
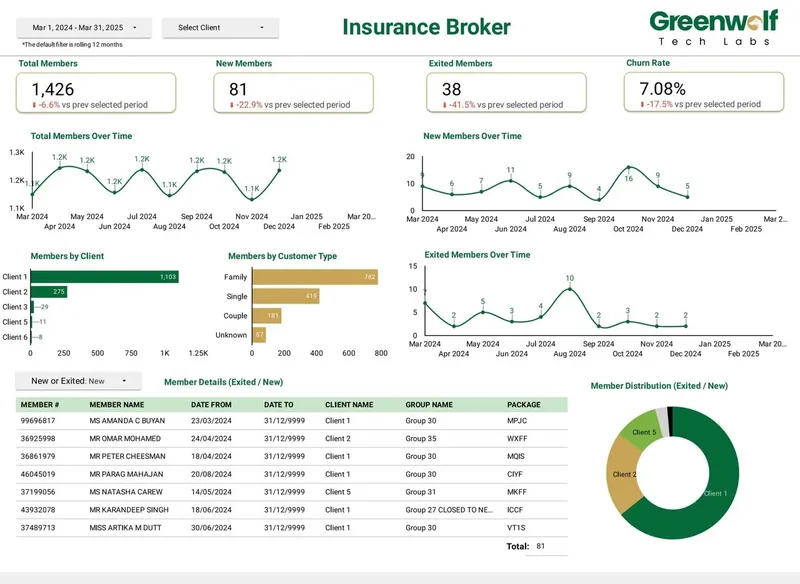
Where the source is a pile of exported files rather than an API, the same discipline applies. On a project I led at Greenwolf Tech Labs for an Australian insurance brokerage, insurer .xls files landed in Google Drive, were mapped into a central Google Sheet with business rules applied, and fed the dashboard. Report time fell from 4-5 hours to under 5 minutes and accuracy rose from about 75% to 99%. For NetSuite, the work covers the integration role, the model, the dashboard, reconciliation against NetSuite for a recent closed month and a handover, with everything owned by your Google Cloud and NetSuite accounts from day one.
Case study · Insurance brokerage, Australia
From 4-5 hours of spreadsheet work to a report in under 5 minutes
A project I led at Greenwolf Tech Labs. Monthly reports were assembled by hand from inconsistent .xls files sent by several insurers. The files now land in Google Drive, are mapped into one central sheet with the business rules applied, and feed a Data Studio dashboard.
- Report time: 4-5 hours to under 5 minutes
- Reporting accuracy: about 75% to 99%
- Visibility across insurers: limited to real time, with filters
FAQ
Frequently asked questions
Does Data Studio have a native NetSuite connector?
No. Data Studio's native connectors cover Google products such as GA4, Google Ads and Search Console, plus Sheets, BigQuery and several SQL databases. NetSuite data needs a partner connector, a pipeline into BigQuery or a Sheet, or exported saved searches.
Is there a NetSuite connector for Looker Studio?
Looker Studio is now called Data Studio again, and the same partner connectors work. Vendors offering NetSuite connections include Windsor.ai, Coupler.io, Improvado, Skyvia, CData Connect Cloud and Coefficient. Check each vendor's pricing page, as none I read publish a NetSuite-specific price.
Can I use SuiteQL to feed Data Studio?
Yes, through a connector or script that sends SuiteQL to NetSuite's REST endpoint and writes the results to a Sheet or BigQuery. Oracle caps REST SuiteQL at 100,000 results, so larger histories should be pulled in date windows or through SuiteAnalytics Connect.
What is SuiteAnalytics Connect and do I need it?
SuiteAnalytics Connect is NetSuite's read-only service for ODBC, JDBC and ADO.NET access to the NetSuite2.com data source. You need it mainly for large extracts or full table replication into a warehouse. It must be enabled on your account, so check with your NetSuite account team.
Why is my NetSuite revenue in Data Studio different from NetSuite?
Usually because of subsidiaries, currency, posting periods or non-posting transactions. Check that charts use the reporting currency amount, filter to posting lines, group by accounting period, and that the integration role can see every subsidiary. Then reconcile against the NetSuite income statement for the same period.
Can I combine NetSuite with Salesforce, HubSpot or Shopify in one report?
Yes. For simple monthly views you can blend sources, keeping in mind blends hold up to 5 sources with equality joins only. For revenue per customer or pipeline-to-invoice views, load each system into BigQuery with matching customer and month keys and report from one prepared table.
How often does NetSuite data refresh in Data Studio?
It depends on the route. Partner connectors query on chart load within the vendor's caching, sync tools run on the schedule your plan allows, which Coupler.io lists from every 15 minutes to monthly, and saved search exports refresh only when someone exports again.
Keep reading
Related pages
Get started
Tell me what the report has to answer
Send the question your team keeps asking and where the data lives today. I reply within one business day with how I would build it, which connectors it needs and what it would cost.
- Free 30-minute review of your data and reports
- A fixed price before any work starts
- Built in your Google account, so you own everything
Prefer email? harsh@greenwolftechlabs.com
Book a free review
Two lines is enough to start.